
Analytics Tabs Overview
The analytics dashboard is organized into three main tabs, each providing specific insights and functionality to help you understand and optimize your AI agent’s performance.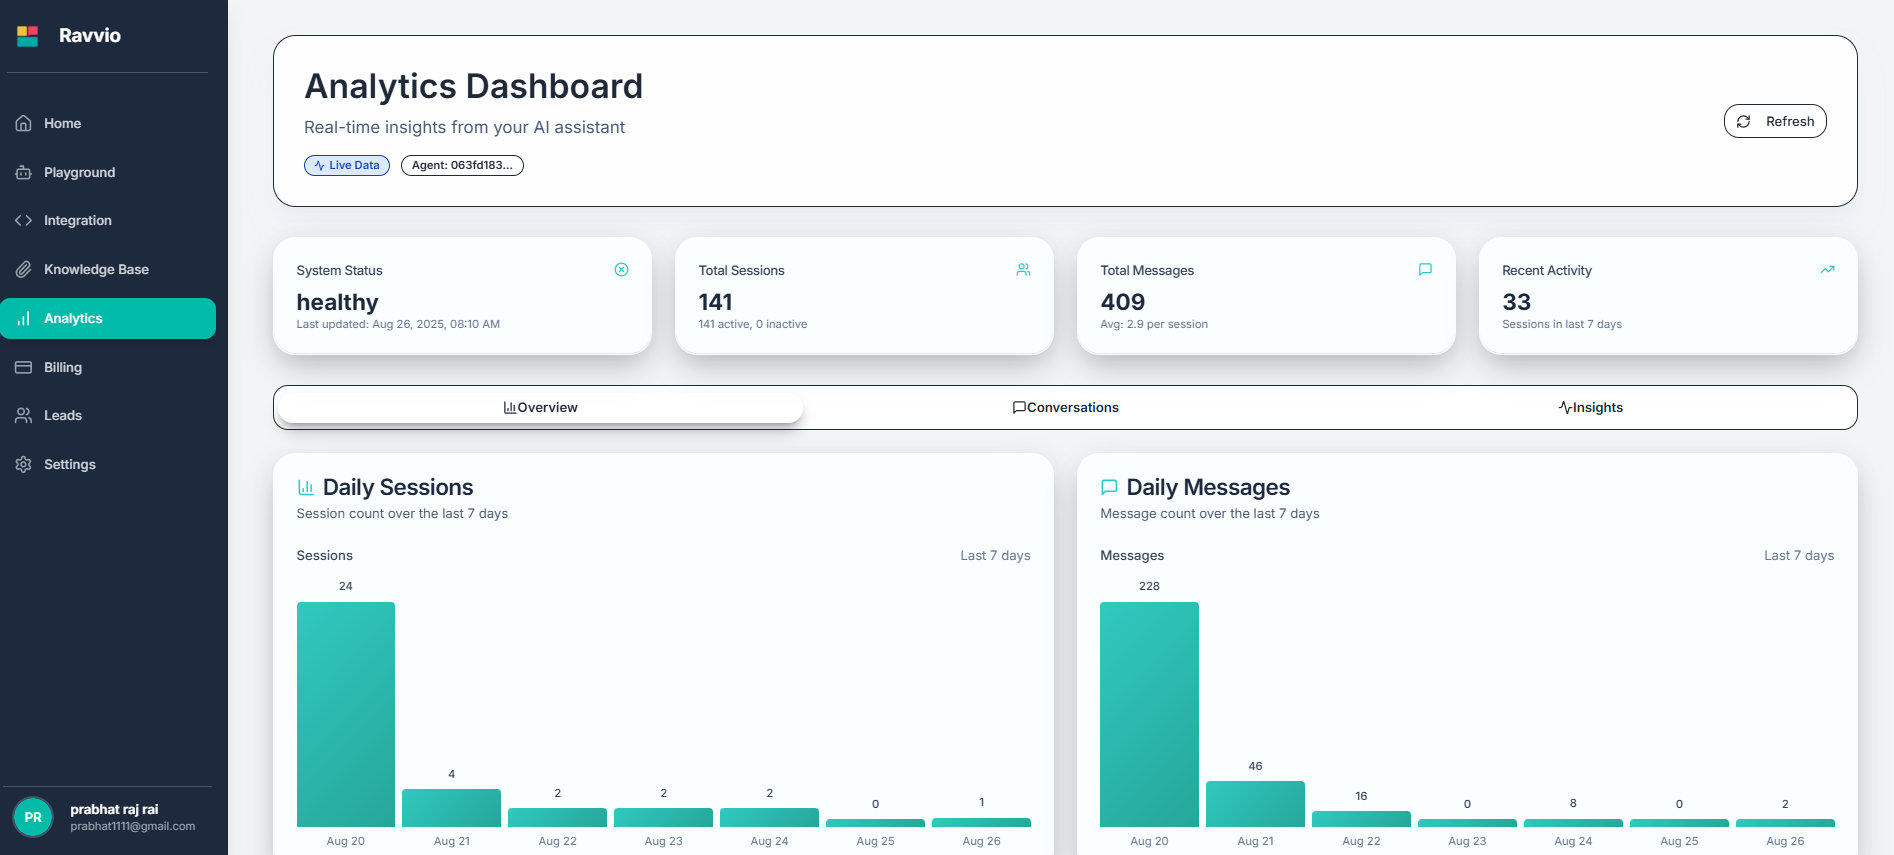
Tab Navigation
Overview Tab
High-level performance metrics with visual charts and quick summaries
Conversations Tab
Detailed conversation analysis with session listings and user interactions
Insights Tab
Advanced analytics with performance analysis and optimization recommendations
Overview Tab
Daily Session Charts
Session Volume Visualization
Session Volume Visualization
Chart Features:
- Interactive daily session count charts
- Line graphs showing session trends over time
- Hover details for specific date information
- Zoom and pan functionality for detailed analysis
- Sessions per day for selected time period
- Weekly and monthly aggregation options
- Comparison with previous periods
- Growth rate indicators and trend analysis
Time Period Selection
Time Period Selection
Flexible Timeframes:
- Last 7 days for recent performance
- Last 30 days for monthly analysis
- Last 90 days for quarterly review
- Custom date range selection
- Period-over-period comparison
- Year-over-year growth tracking
- Seasonal pattern identification
- Peak performance period analysis
Message Volume Trends
Message Count Visualization
Trend Charts:
- Daily message volume line charts
- Interactive data points with detailed information
- Multiple trend lines for different metrics
- Smooth curve fitting for trend identification
Volume Analysis
Message Patterns:
- Peak messaging hours identification
- Daily, weekly, and monthly patterns
- Volume correlation with session count
- Average messages per session trends
Visual Performance Indicators
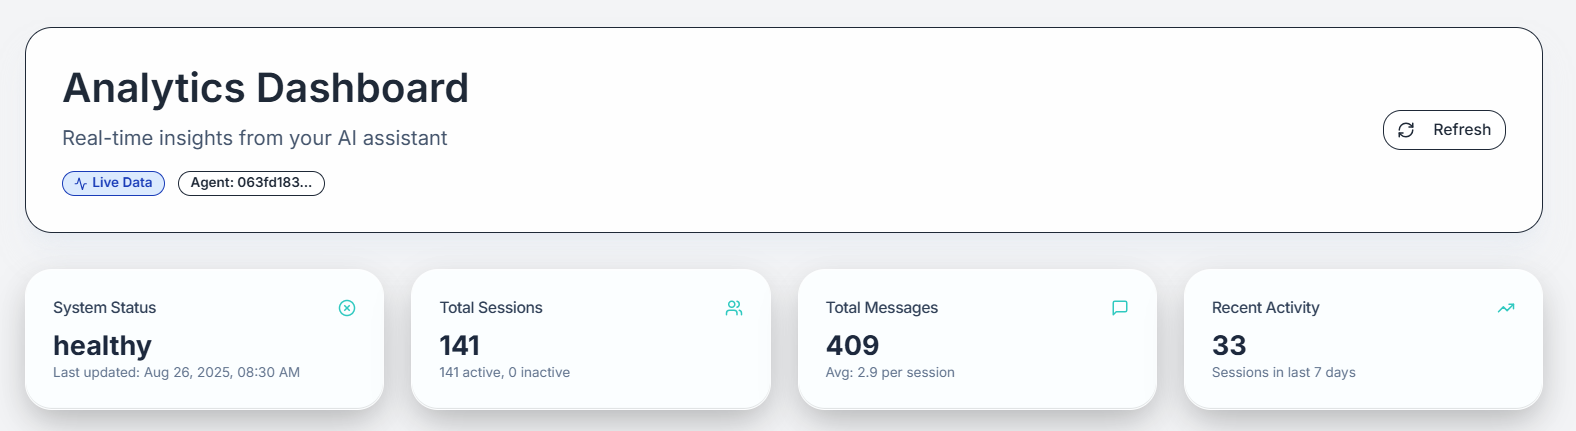
Key Metrics Cards
At-a-Glance Information:
- Total sessions with growth percentage
- Total messages with trend indicators
- Average session duration and changes
- Lead conversion rates and improvements
Status Indicators
System Health:
- Agent operational status with color coding
- Knowledge base health indicators
- Performance benchmarks and alerts
- Integration status and connectivity
Quick Metric Summaries
Performance Summary Cards
Performance Summary Cards
Essential Metrics:
- Session count with percentage change
- Message volume with trend indicators
- Response time averages and improvements
- User engagement scores and changes
- Color-coded performance indicators
- Arrow indicators for trends (up/down)
- Progress bars for goal achievement
- Sparkline charts for quick trend visualization
Business Impact Summary
Business Impact Summary
Key Business Metrics:
- Lead generation numbers and conversion rates
- Revenue attribution and ROI indicators
- Customer satisfaction scores and trends
- Cost per interaction and efficiency metrics
- Performance improvement opportunities
- Goal achievement status and progress
- Alert indicators for attention areas
- Success celebration and milestone recognition
Conversations Tab
Recent Session Listings
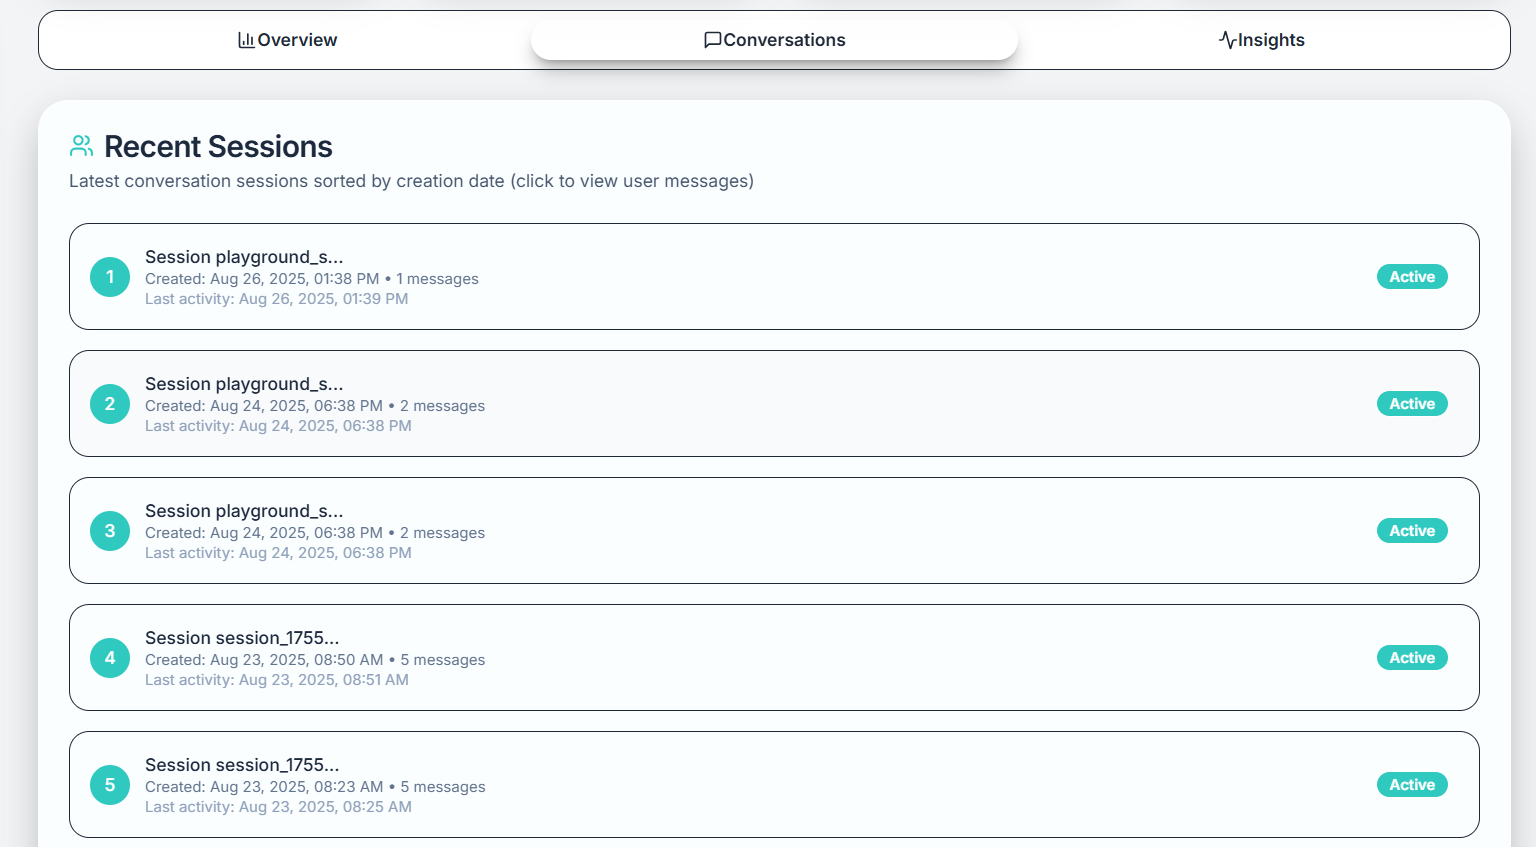
Session List Display
Session Information:
- Chronological list of recent conversations
- Session duration and message count
- User engagement level indicators
- Lead conversion status and outcomes
Filtering and Sorting
Organization Tools:
- Date range filtering options
- Sort by duration, messages, or conversion
- Search functionality for specific sessions
- Status filtering (completed, abandoned, converted)
Session Details and Metadata
Technical Details
Session Metadata:
- Session ID and tracking information
- Start and end timestamps
- Device and browser information
- Geographic location data
- Referral source and campaign attribution
Performance Metrics
Session Analytics:
- Response time performance
- User engagement scoring
- Knowledge base utilization
- Conversation quality assessment
- Lead generation effectiveness
User Message Previews
Conversation Snippets
Conversation Snippets
Message Previews:
- First and last message from each session
- Key conversation highlights and topics
- User questions and agent responses
- Lead capture interactions and outcomes
- Conversation topics and themes
- Product or service interests identified
- Pain points and challenges mentioned
- Decision-making indicators and buying signals
Quality Assessment
Quality Assessment
Response Analysis:
- Agent response quality ratings
- User satisfaction indicators
- Conversation completion status
- Follow-up action recommendations
- Common question patterns needing better responses
- Knowledge gaps identified through conversations
- User experience friction points
- Optimization suggestions based on interactions
Interaction Timestamps
Timeline Visualization
Chronological Display:
- Detailed timestamp for each interaction
- Message timing and response delays
- Conversation flow and pacing analysis
- Peak activity time identification
Performance Analysis
Timing Metrics:
- Average response times per session
- User wait times and engagement patterns
- Conversation momentum and flow
- Optimal interaction timing identification
Insights Tab
Performance Metrics Analysis
Deep Analytics
Advanced Metrics:
- Conversation success rate analysis
- User journey mapping and optimization
- Content effectiveness measurement
- ROI calculation and attribution
Comparative Analysis
Benchmarking:
- Performance against industry standards
- Historical performance comparison
- Goal achievement tracking
- Competitive positioning analysis
Conversation Rate Calculations
Conversion Metrics
Conversion Metrics
Rate Calculations:
- Visitor-to-conversation conversion rates
- Conversation-to-lead conversion rates
- Lead-to-customer conversion rates
- Overall funnel conversion analysis
- Conversion rate trends over time
- Factors influencing conversion success
- Optimization impact measurement
- A/B testing results and improvements
Engagement Analysis
Engagement Analysis
Interaction Quality:
- Average conversation depth and engagement
- User satisfaction correlation with outcomes
- Response quality impact on conversions
- Optimal conversation length identification
- User engagement patterns and preferences
- Most effective conversation paths
- Common objection handling success rates
- Personalization impact on engagement
Activity Pattern Identification
Usage Patterns
Pattern Recognition:
- Daily, weekly, and monthly activity cycles
- Peak usage times and optimal availability
- Seasonal trends and business cycle impacts
- Geographic and demographic patterns
User Behavior Analysis
Behavioral Insights:
- Common user journey paths and preferences
- Question types and information seeking patterns
- Decision-making processes and timing
- Repeat user behavior and loyalty indicators
Engagement Optimization Suggestions
Automated Recommendations
AI-Powered Insights:
- Performance improvement suggestions
- Content optimization recommendations
- Configuration adjustment proposals
- Best practice implementation guidance
Strategic Insights
Business Intelligence:
- Market opportunity identification
- Competitive advantage recommendations
- Customer experience enhancement strategies
- Revenue optimization opportunities
Cross-Tab Functionality
Data Integration
Unified Analytics
Unified Analytics
Comprehensive View:
- Data correlation across all tabs
- Cross-reference capabilities between views
- Unified filtering and date range selection
- Consistent metric calculations and definitions
- Easy tab switching with context preservation
- Drill-down capabilities from summary to detail
- Related information linking and references
- Breadcrumb navigation for complex analysis
Export Integration
Export Integration
Data Portability:
- Export data from any tab in multiple formats
- Combined reports across all analytics tabs
- Scheduled reporting with multi-tab insights
- Custom dashboard creation with cross-tab data
- Share specific tab views with team members
- Annotate and comment on analytics insights
- Collaborative analysis and decision-making
- Team dashboard customization and preferences
Real-Time Updates
Live Data Refresh
Dynamic Updates:
- Real-time data synchronization across all tabs
- Automatic refresh for active sessions and metrics
- Live notification of significant changes
- Instant reflection of configuration updates
Performance Monitoring
Continuous Tracking:
- Real-time performance alerts and notifications
- Live system health monitoring across tabs
- Immediate issue detection and reporting
- Proactive maintenance and optimization alerts
Data Consistency: All tabs share the same underlying data source, ensuring consistency and accuracy across different views and analysis perspectives.