> ## Documentation Index
> Fetch the complete documentation index at: https://docs.ravvio.in/llms.txt
> Use this file to discover all available pages before exploring further.
# Dashboard Overview
> Comprehensive overview of your Ravvio dashboard and its components
## Dashboard Introduction
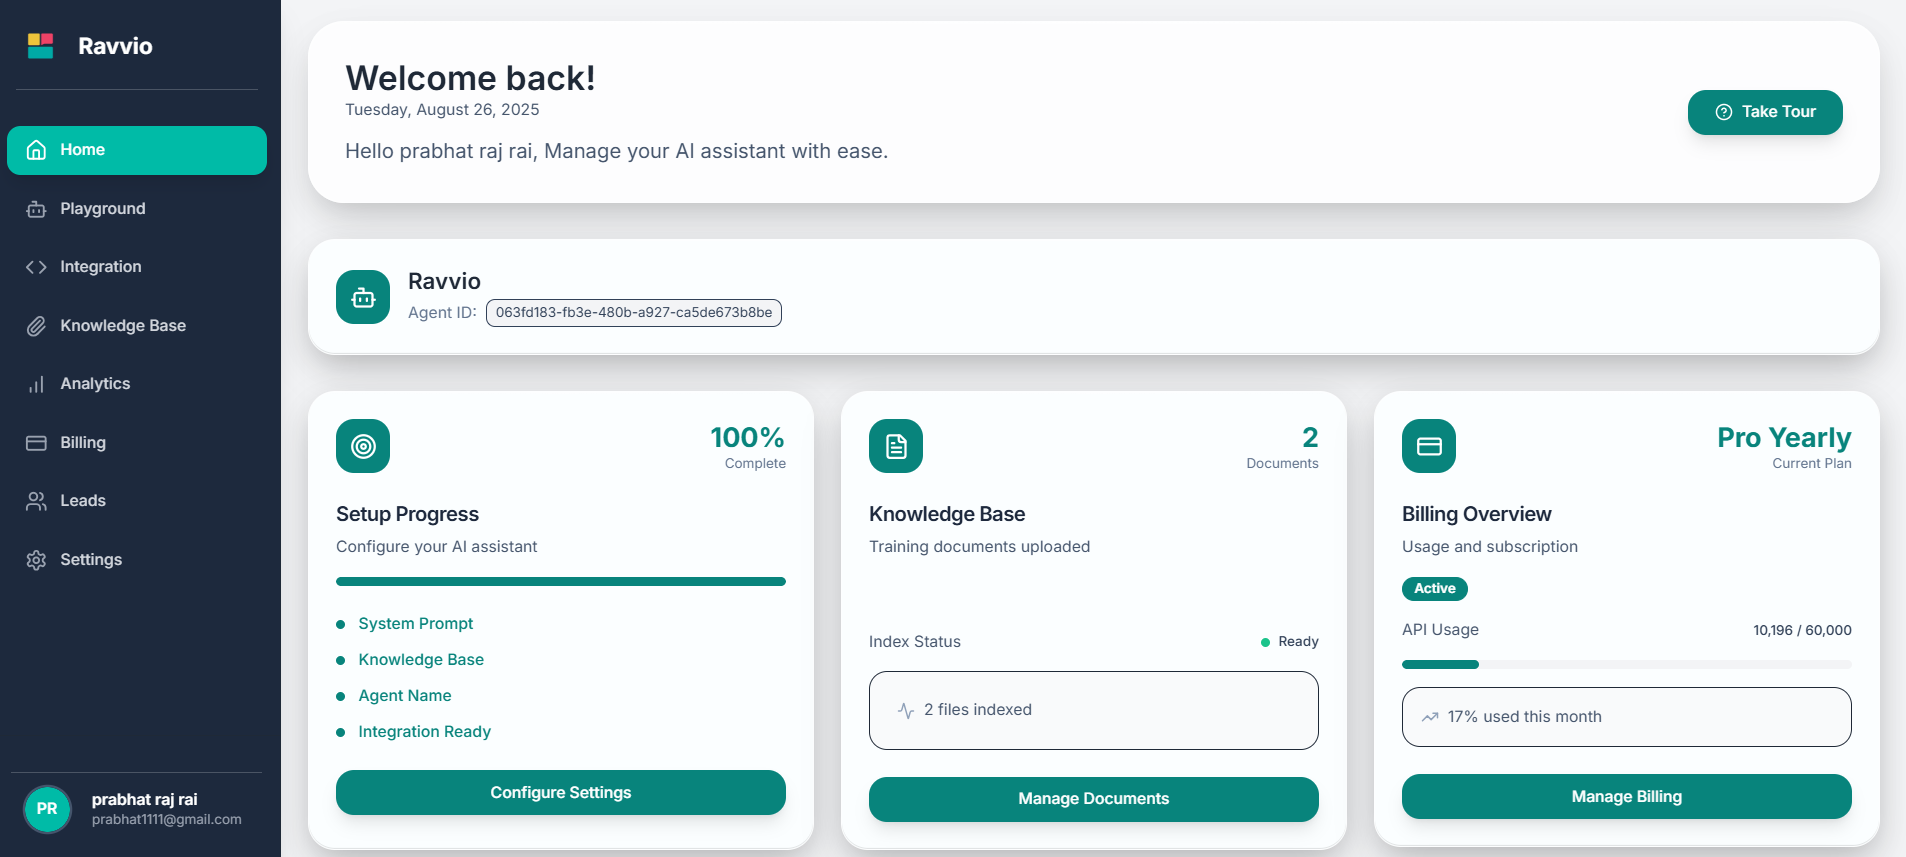
Your Ravvio dashboard provides a comprehensive view of your AI agent's performance and setup progress, serving as the central hub for managing all aspects of your chatbot platform.
 ### Dashboard Purpose
The dashboard is designed to:
Track your agent configuration and setup completion status
View key metrics and analytics about your agent's performance
Access frequently used features and tools efficiently
Monitor your agent's operational status and system health
## Main Dashboard Components
### Welcome Section
Your dashboard begins with a personalized welcome area featuring:
* Welcome message with your name
* Current date and time display
* Contextual information about your account status
* Quick view of your AI agent's current state
* Setup completion indicators
* Operational health status
* Visual representation of setup completion
* Step-by-step configuration guidance
* Achievement indicators and milestones
### Agent Information Card
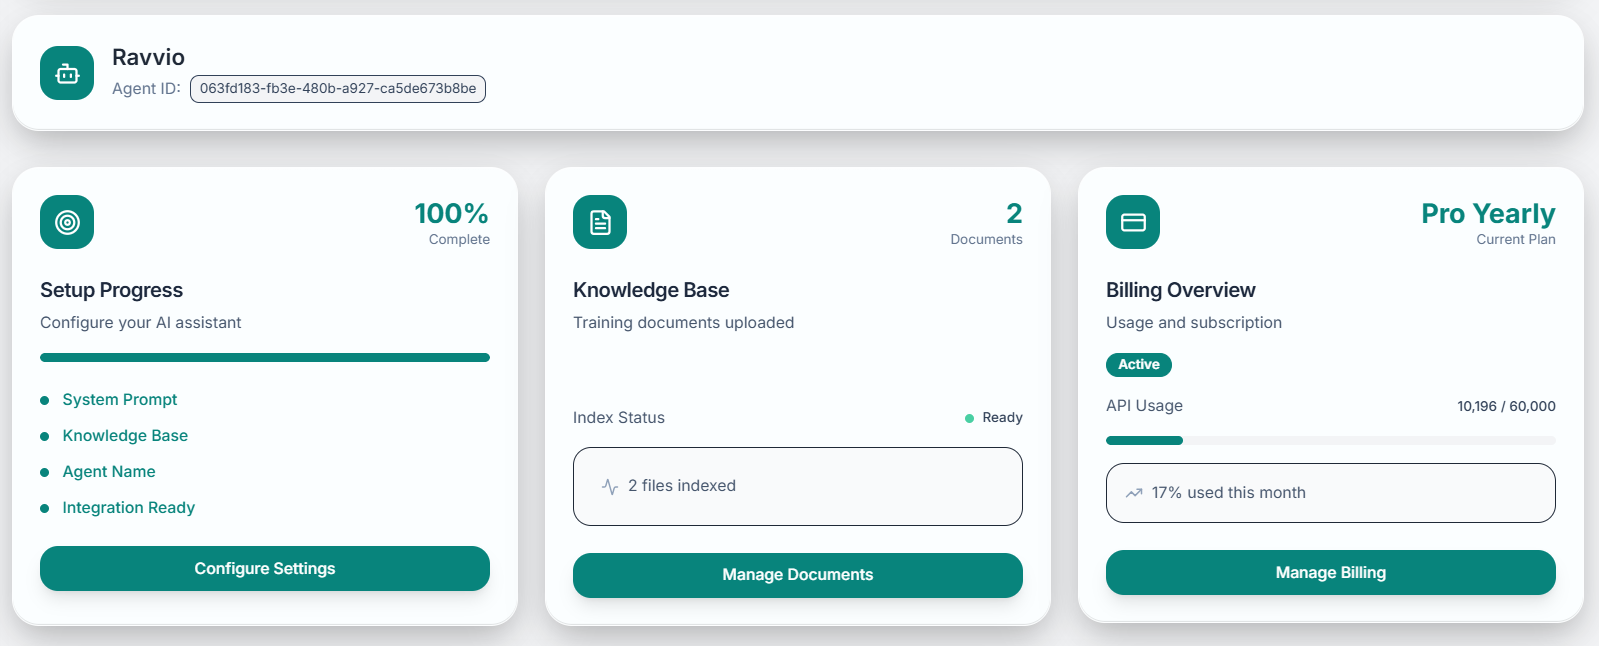
Central display of your AI agent details:
### Dashboard Purpose
The dashboard is designed to:
Track your agent configuration and setup completion status
View key metrics and analytics about your agent's performance
Access frequently used features and tools efficiently
Monitor your agent's operational status and system health
## Main Dashboard Components
### Welcome Section
Your dashboard begins with a personalized welcome area featuring:
* Welcome message with your name
* Current date and time display
* Contextual information about your account status
* Quick view of your AI agent's current state
* Setup completion indicators
* Operational health status
* Visual representation of setup completion
* Step-by-step configuration guidance
* Achievement indicators and milestones
### Agent Information Card
Central display of your AI agent details:
 | Information | Purpose | Actions Available |
| --------------------- | ----------------------------------- | ---------------------- |
| **Agent Name** | Display configured agent identity | Quick edit option |
| **Unique Agent ID** | Integration and tracking identifier | Copy to clipboard |
| **Setup Status** | Configuration completion indicator | View detailed progress |
| **Operational State** | Real-time agent health status | Access diagnostics |
Your agent ID is crucial for website integration. Keep this identifier secure and accessible.
### Setup Progress Tracker
Visual tracking of your agent configuration with four key areas:
| Information | Purpose | Actions Available |
| --------------------- | ----------------------------------- | ---------------------- |
| **Agent Name** | Display configured agent identity | Quick edit option |
| **Unique Agent ID** | Integration and tracking identifier | Copy to clipboard |
| **Setup Status** | Configuration completion indicator | View detailed progress |
| **Operational State** | Real-time agent health status | Access diagnostics |
Your agent ID is crucial for website integration. Keep this identifier secure and accessible.
### Setup Progress Tracker
Visual tracking of your agent configuration with four key areas:
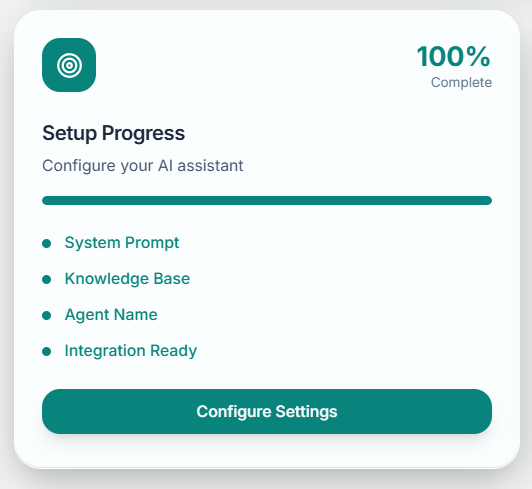 **Purpose**: Customize AI behavior and personality
**Status**: Shows completion percentage
**Action**: Direct link to system prompt editor
**Purpose**: Upload and manage training documents
**Status**: Document count and processing status
**Action**: Quick access to document upload
**Purpose**: Personalize your agent's identity
**Status**: Default vs. customized name indicator
**Action**: Inline name editing capability
**Purpose**: Prepare for website embedding
**Status**: Deployment readiness assessment
**Action**: Generate integration code
## Performance Metrics
### Key Statistics Display
All-time conversation count with your AI agent
Currently ongoing conversations
Complete message exchange count
Sessions and interactions in the last 7 days
### Performance Indicators
* Average messages per conversation
* Session duration statistics
* User return rate indicators
* Conversation completion rates
* Agent response time performance
* Knowledge base index status
* System uptime and availability
* Error rate and resolution tracking
* Daily and weekly usage patterns
* Peak activity time identification
* Seasonal trend analysis
* Growth trajectory indicators
## Navigation and Layout
### Dashboard Layout Structure
The dashboard follows a logical layout hierarchy:
1. **Header Section**: Navigation, user controls, and quick actions
2. **Welcome Area**: Personalized greeting and high-level status
3. **Progress Section**: Configuration completion tracking
4. **Metrics Area**: Performance statistics and indicators
5. **Quick Actions**: Tabbed interface for common tasks
### Responsive Design
The dashboard automatically adapts to different screen sizes, ensuring optimal experience on desktop, tablet, and mobile devices.
#### Desktop Experience
* Full-width layout with multiple columns
* Expanded navigation and menu options
* Detailed statistics and charts display
* Comprehensive quick action panels
#### Mobile Experience
* Single-column responsive layout
* Collapsible navigation menus
* Touch-optimized interface elements
* Swipeable tabs and sections
## Dashboard Customization
### Personalization Options
Customize information density and layout preferences
Control dashboard alerts and update notifications
Organize frequently used tools and features
Adjust visual appearance and color schemes
### Widget Organization
Arrange dashboard components based on your workflow:
* **Drag and Drop**: Reorganize sections to match your priorities
* **Show/Hide Widgets**: Display only relevant information
* **Size Adjustment**: Customize widget dimensions for optimal viewing
* **Default Layouts**: Reset to standard configuration when needed
Some dashboard elements cannot be moved or hidden as they contain critical system information.
## Dashboard Performance
### Loading and Responsiveness
The dashboard is optimized for:
* **Fast Initial Load**: Critical information appears immediately
* **Progressive Enhancement**: Additional details load in background
* **Real-time Updates**: Key metrics refresh automatically
* **Efficient Navigation**: Smooth transitions between sections
### Data Refresh
* Key metrics refresh every 5 minutes
* Status indicators update in real-time
* Notifications appear instantly
* Background sync maintains data freshness
* Refresh button available for immediate updates
* Individual widget refresh options
* Full dashboard reload capability
* Force sync for troubleshooting
## Getting Started Tips
### First-Time Users
Complete the welcome tour to understand key features and navigation
Check your setup progress and prioritize incomplete configurations
Familiarize yourself with available statistics and their meanings
Use quick actions to access and test various platform capabilities
### Optimization Recommendations
Focus on completing setup steps in order to maximize your dashboard's usefulness and your agent's performance.
* **Complete System Prompt**: Essential for agent behavior
* **Upload Knowledge Base**: Enables accurate responses
* **Customize Agent Name**: Improves brand consistency
* **Test Integration**: Verify deployment readiness
The dashboard becomes more useful as you complete setup steps and begin using your AI agent actively.
**Purpose**: Customize AI behavior and personality
**Status**: Shows completion percentage
**Action**: Direct link to system prompt editor
**Purpose**: Upload and manage training documents
**Status**: Document count and processing status
**Action**: Quick access to document upload
**Purpose**: Personalize your agent's identity
**Status**: Default vs. customized name indicator
**Action**: Inline name editing capability
**Purpose**: Prepare for website embedding
**Status**: Deployment readiness assessment
**Action**: Generate integration code
## Performance Metrics
### Key Statistics Display
All-time conversation count with your AI agent
Currently ongoing conversations
Complete message exchange count
Sessions and interactions in the last 7 days
### Performance Indicators
* Average messages per conversation
* Session duration statistics
* User return rate indicators
* Conversation completion rates
* Agent response time performance
* Knowledge base index status
* System uptime and availability
* Error rate and resolution tracking
* Daily and weekly usage patterns
* Peak activity time identification
* Seasonal trend analysis
* Growth trajectory indicators
## Navigation and Layout
### Dashboard Layout Structure
The dashboard follows a logical layout hierarchy:
1. **Header Section**: Navigation, user controls, and quick actions
2. **Welcome Area**: Personalized greeting and high-level status
3. **Progress Section**: Configuration completion tracking
4. **Metrics Area**: Performance statistics and indicators
5. **Quick Actions**: Tabbed interface for common tasks
### Responsive Design
The dashboard automatically adapts to different screen sizes, ensuring optimal experience on desktop, tablet, and mobile devices.
#### Desktop Experience
* Full-width layout with multiple columns
* Expanded navigation and menu options
* Detailed statistics and charts display
* Comprehensive quick action panels
#### Mobile Experience
* Single-column responsive layout
* Collapsible navigation menus
* Touch-optimized interface elements
* Swipeable tabs and sections
## Dashboard Customization
### Personalization Options
Customize information density and layout preferences
Control dashboard alerts and update notifications
Organize frequently used tools and features
Adjust visual appearance and color schemes
### Widget Organization
Arrange dashboard components based on your workflow:
* **Drag and Drop**: Reorganize sections to match your priorities
* **Show/Hide Widgets**: Display only relevant information
* **Size Adjustment**: Customize widget dimensions for optimal viewing
* **Default Layouts**: Reset to standard configuration when needed
Some dashboard elements cannot be moved or hidden as they contain critical system information.
## Dashboard Performance
### Loading and Responsiveness
The dashboard is optimized for:
* **Fast Initial Load**: Critical information appears immediately
* **Progressive Enhancement**: Additional details load in background
* **Real-time Updates**: Key metrics refresh automatically
* **Efficient Navigation**: Smooth transitions between sections
### Data Refresh
* Key metrics refresh every 5 minutes
* Status indicators update in real-time
* Notifications appear instantly
* Background sync maintains data freshness
* Refresh button available for immediate updates
* Individual widget refresh options
* Full dashboard reload capability
* Force sync for troubleshooting
## Getting Started Tips
### First-Time Users
Complete the welcome tour to understand key features and navigation
Check your setup progress and prioritize incomplete configurations
Familiarize yourself with available statistics and their meanings
Use quick actions to access and test various platform capabilities
### Optimization Recommendations
Focus on completing setup steps in order to maximize your dashboard's usefulness and your agent's performance.
* **Complete System Prompt**: Essential for agent behavior
* **Upload Knowledge Base**: Enables accurate responses
* **Customize Agent Name**: Improves brand consistency
* **Test Integration**: Verify deployment readiness
The dashboard becomes more useful as you complete setup steps and begin using your AI agent actively.