> ## Documentation Index
> Fetch the complete documentation index at: https://docs.ravvio.in/llms.txt
> Use this file to discover all available pages before exploring further.
# Main Dashboard Features
> Detailed overview of key dashboard components and functionality
## Core Dashboard Components
Your Ravvio dashboard is built around several key components that provide comprehensive control and insights into your AI agent's performance.
### Welcome Section Features
Dynamic welcome message with your name and current date display
Real-time view of your AI agent's operational status and health
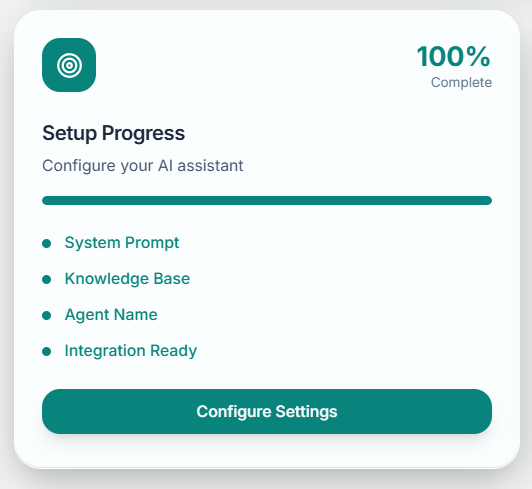
Visual indicator showing configuration completion percentage
Instant access to most important features and settings
### Agent Information Display
**Agent Name**: Display of your customized agent name or default "\[Your Name]'s Assistant"
**Unique Agent ID**: Alphanumeric identifier required for website integration
**Creation Date**: When your agent was first created
**Last Modified**: Most recent configuration update timestamp
**System Prompt**: Completion status of AI behavior configuration
**Knowledge Base**: Number of uploaded documents and processing status
**Integration Settings**: Widget customization and deployment readiness
**Performance Metrics**: Basic statistics about agent interactions
**Edit Agent Name**: Inline editing capability for agent identity
**Copy Agent ID**: One-click copying for integration purposes
**View Analytics**: Direct link to comprehensive performance data
**Access Integration**: Jump to deployment code generation
## Setup Progress Tracking
 ### Progress Components
The setup tracker monitors four critical configuration areas:
**Purpose**: Define your AI agent's personality, role, and response behavior
**Status Indicators**:
* 🔴 Not Started: Default prompt in use
* 🟡 In Progress: Custom prompt partially configured
* 🟢 Complete: Fully customized system prompt active
**Quick Actions**: Edit system prompt, use AI generation, test in playground
**Purpose**: Upload training documents for accurate, context-aware responses
**Status Indicators**:
* 🔴 Empty: No documents uploaded
* 🟡 Processing: Documents being indexed
* 🟢 Ready: Documents processed and available
**Quick Actions**: Upload documents, view processing status, manage files
**Purpose**: Personalize your agent's identity to match your brand
**Status Indicators**:
* 🔴 Default: Using system-generated name
* 🟢 Customized: Personalized name configured
**Quick Actions**: Edit name inline, preview appearance, save changes
**Purpose**: Prepare agent for website deployment
**Status Indicators**:
* 🔴 Not Ready: Prerequisites incomplete
* 🟡 Partial: Some requirements met
* 🟢 Ready: All systems prepared for deployment
**Quick Actions**: Generate integration code, preview widget, test deployment
### Progress Calculation
Progress percentage is calculated based on completion of all four setup areas. Each completed area contributes 25% to the total progress score.
## Performance Metrics Display
### Key Statistics
* **Total Sessions**: All-time conversation count
* **Active Sessions**: Currently ongoing conversations
* **Session Growth**: Trend analysis over time
* **Average Duration**: Typical conversation length
* **Total Messages**: Complete message exchange count
* **Messages Per Session**: Average interaction depth
* **Response Time**: Average agent response speed
* **Success Rate**: Percentage of successful interactions
* **Agent Status**: Operational health indicator
* **Index Status**: Knowledge base processing state
* **Error Rate**: System reliability metrics
* **Uptime**: Service availability percentage
* **Last 7 Days**: Recent session and message counts
* **Peak Hours**: Most active conversation times
* **Daily Trends**: Usage pattern analysis
* **Growth Indicators**: Performance improvement metrics
### Metric Interpretations
**High Session Count**: Indicates strong user engagement and traffic
**Low Session Count**: May suggest need for better promotion or placement
**Active Sessions**: Shows real-time user engagement level
**Session Duration**: Longer sessions typically indicate more complex queries or higher engagement
**Messages Per Session**: Higher ratios suggest engaging conversations
**Response Time**: Lower times indicate better user experience
**Success Rate**: Measures how often agent provides helpful responses
**Message Growth**: Indicates increasing user adoption
**Agent Status**: Green indicates optimal performance
**Index Status**: Ensures knowledge base is functioning properly
**Error Rates**: Low percentages indicate system stability
**Uptime**: High percentages show reliable service availability
## Navigation and Control Features
### Primary Navigation
Direct navigation to all major platform features and tools
Quick access to configuration options and preferences
Documentation, tutorials, and help system access
Profile management, billing, and subscription options
### Dashboard Customization
* Drag and drop functionality for dashboard layout
* Resize widgets based on importance and preference
* Show/hide specific information panels
* Save custom layouts for different use cases
* Toggle between detailed and summary views
* Customize color schemes and visual themes
* Adjust information density and spacing
* Configure notification display preferences
* Control automatic refresh intervals
* Manual refresh options for real-time data
* Configure which metrics update automatically
* Set alert thresholds for important changes
## Dashboard Notifications
### Alert Types
Critical notifications about agent health, errors, or maintenance
Updates about usage limits, credit consumption, or performance changes
Prompts to complete setup steps or update settings
Information about new capabilities and platform improvements
### Notification Management
Customize notification preferences in your profile settings to control which alerts appear on your dashboard.
## Mobile Dashboard Experience
### Mobile Optimization
Dashboard automatically adapts to mobile screen sizes
Optimized controls for touch-based navigation
Essential features accessible with minimal scrolling
Clear status when internet connectivity is limited
### Mobile-Specific Features
* **Swipe Navigation**: Gesture-based movement between sections
* **Collapsible Panels**: Expandable sections to maximize screen space
* **Priority Information**: Most important metrics displayed prominently
* **Quick Settings**: Essential controls accessible from main screen
The mobile dashboard prioritizes the most critical information and actions, ensuring you can manage your agent effectively from any device.
### Progress Components
The setup tracker monitors four critical configuration areas:
**Purpose**: Define your AI agent's personality, role, and response behavior
**Status Indicators**:
* 🔴 Not Started: Default prompt in use
* 🟡 In Progress: Custom prompt partially configured
* 🟢 Complete: Fully customized system prompt active
**Quick Actions**: Edit system prompt, use AI generation, test in playground
**Purpose**: Upload training documents for accurate, context-aware responses
**Status Indicators**:
* 🔴 Empty: No documents uploaded
* 🟡 Processing: Documents being indexed
* 🟢 Ready: Documents processed and available
**Quick Actions**: Upload documents, view processing status, manage files
**Purpose**: Personalize your agent's identity to match your brand
**Status Indicators**:
* 🔴 Default: Using system-generated name
* 🟢 Customized: Personalized name configured
**Quick Actions**: Edit name inline, preview appearance, save changes
**Purpose**: Prepare agent for website deployment
**Status Indicators**:
* 🔴 Not Ready: Prerequisites incomplete
* 🟡 Partial: Some requirements met
* 🟢 Ready: All systems prepared for deployment
**Quick Actions**: Generate integration code, preview widget, test deployment
### Progress Calculation
Progress percentage is calculated based on completion of all four setup areas. Each completed area contributes 25% to the total progress score.
## Performance Metrics Display
### Key Statistics
* **Total Sessions**: All-time conversation count
* **Active Sessions**: Currently ongoing conversations
* **Session Growth**: Trend analysis over time
* **Average Duration**: Typical conversation length
* **Total Messages**: Complete message exchange count
* **Messages Per Session**: Average interaction depth
* **Response Time**: Average agent response speed
* **Success Rate**: Percentage of successful interactions
* **Agent Status**: Operational health indicator
* **Index Status**: Knowledge base processing state
* **Error Rate**: System reliability metrics
* **Uptime**: Service availability percentage
* **Last 7 Days**: Recent session and message counts
* **Peak Hours**: Most active conversation times
* **Daily Trends**: Usage pattern analysis
* **Growth Indicators**: Performance improvement metrics
### Metric Interpretations
**High Session Count**: Indicates strong user engagement and traffic
**Low Session Count**: May suggest need for better promotion or placement
**Active Sessions**: Shows real-time user engagement level
**Session Duration**: Longer sessions typically indicate more complex queries or higher engagement
**Messages Per Session**: Higher ratios suggest engaging conversations
**Response Time**: Lower times indicate better user experience
**Success Rate**: Measures how often agent provides helpful responses
**Message Growth**: Indicates increasing user adoption
**Agent Status**: Green indicates optimal performance
**Index Status**: Ensures knowledge base is functioning properly
**Error Rates**: Low percentages indicate system stability
**Uptime**: High percentages show reliable service availability
## Navigation and Control Features
### Primary Navigation
Direct navigation to all major platform features and tools
Quick access to configuration options and preferences
Documentation, tutorials, and help system access
Profile management, billing, and subscription options
### Dashboard Customization
* Drag and drop functionality for dashboard layout
* Resize widgets based on importance and preference
* Show/hide specific information panels
* Save custom layouts for different use cases
* Toggle between detailed and summary views
* Customize color schemes and visual themes
* Adjust information density and spacing
* Configure notification display preferences
* Control automatic refresh intervals
* Manual refresh options for real-time data
* Configure which metrics update automatically
* Set alert thresholds for important changes
## Dashboard Notifications
### Alert Types
Critical notifications about agent health, errors, or maintenance
Updates about usage limits, credit consumption, or performance changes
Prompts to complete setup steps or update settings
Information about new capabilities and platform improvements
### Notification Management
Customize notification preferences in your profile settings to control which alerts appear on your dashboard.
## Mobile Dashboard Experience
### Mobile Optimization
Dashboard automatically adapts to mobile screen sizes
Optimized controls for touch-based navigation
Essential features accessible with minimal scrolling
Clear status when internet connectivity is limited
### Mobile-Specific Features
* **Swipe Navigation**: Gesture-based movement between sections
* **Collapsible Panels**: Expandable sections to maximize screen space
* **Priority Information**: Most important metrics displayed prominently
* **Quick Settings**: Essential controls accessible from main screen
The mobile dashboard prioritizes the most critical information and actions, ensuring you can manage your agent effectively from any device.